

Enhancing Operations for a Romanian Bakery Chain Industry: Food – Confectionery Business Overview: Operating 13 outlets in Kuwait Challenges: POS...
In today’s fast-paced business environment, organizations generate large volumes of data across sales, finance, inventory, human resources, purchasing, manufacturing, and other operations. However, having access to data alone is not enough. Businesses need a simple and intelligent way to understand their data, identify important trends, and make informed decisions.
An AI Dashboard is an intelligent business analytics solution that collects and presents information from different business processes in a centralized and easy-to-understand interface. It combines interactive dashboards, real-time data visualization, automated reporting, and artificial intelligence to help businesses understand their performance and make better decisions.
Instead of manually reviewing spreadsheets and reports, businesses can use an AI Dashboard to monitor important Key Performance Indicators (KPIs), analyze business trends, and access relevant information from a single platform.
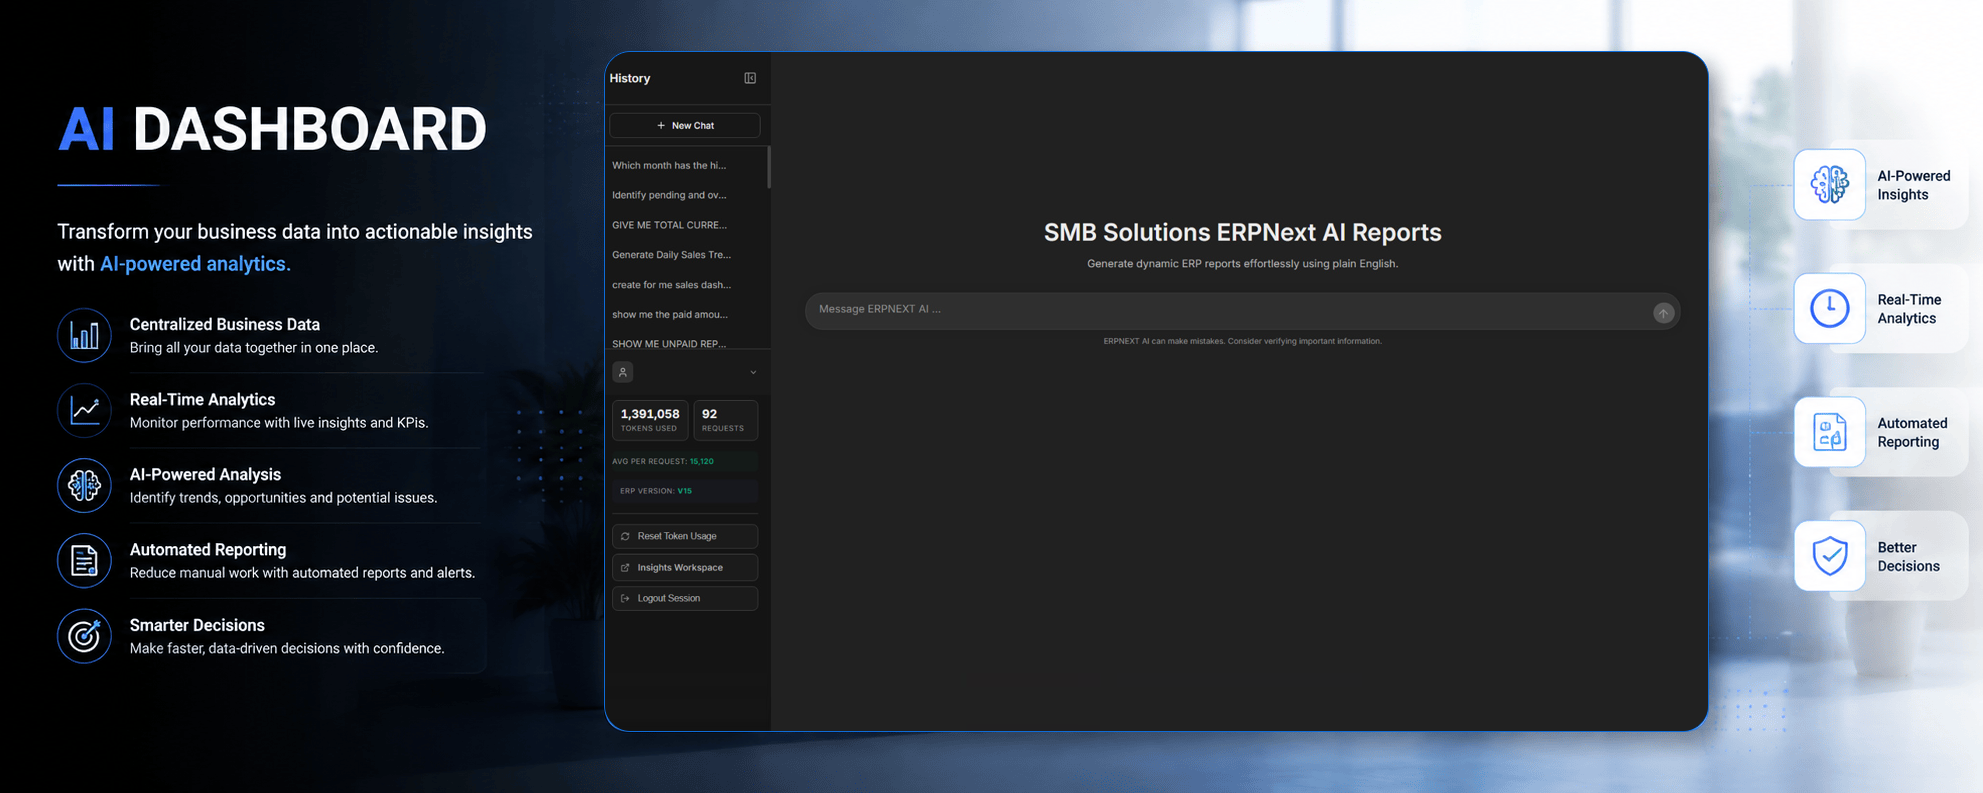
AI-powered analytics can also help identify patterns, unusual changes, and important business trends within the available data. This enables management teams to gain better visibility into their operations and respond to business requirements more effectively.
AI Dashboard provides real-time visibility into important business information. Management teams can monitor sales, revenue, inventory, expenses, employee performance, and other operational metrics from a centralized dashboard.
Complex business information can be presented through easy-to-understand charts, graphs, tables, and visual indicators. This makes it easier for users to understand business performance and identify important trends.
AI capabilities help analyze business data and provide meaningful insights. The system can identify patterns, trends, and unusual changes in data, helping businesses understand what is happening across their operations.
Businesses can define and monitor important Key Performance Indicators according to their requirements. Management can quickly review performance against targets and identify areas that require attention.
AI Dashboard reduces the need for manually preparing business reports. Users can access regularly updated reports and dashboards while reducing the time spent collecting and organizing information from different sources.
AI-powered analytics can help businesses identify potential future trends based on available historical and operational data. This can support better planning, forecasting, and decision-making.
Users can interact with business data using simple, natural-language questions. Instead of manually searching through multiple reports, users can ask questions about their business information and obtain relevant insights.
Every business has different reporting requirements. AI Dashboard can be customized according to business needs, allowing users to focus on the KPIs, reports, and information that are most important to their operations.
Given below are some essential AI Dashboard benefits that you need to know:
AI Dashboard provides management with relevant and timely business information. By having important performance indicators and insights available in one place, decision-makers can make more informed business decisions.
A centralized dashboard provides a comprehensive view of business operations. Management can monitor different departments and processes without depending on multiple spreadsheets or manually prepared reports.
AI Dashboard automates the collection, organization, visualization, and reporting of business information. This reduces repetitive manual work and allows employees to spend more time on important business activities.
Businesses can analyze large amounts of information through interactive dashboards and AI-powered analytics. This makes it easier to identify trends, compare performance, and understand important changes in business data.
By providing better visibility into business processes, AI Dashboard helps organizations identify inefficiencies and areas that require improvement. This enables teams to respond faster and improve overall operational performance.
AI Dashboard helps organizations move from assumption-based decisions to data-driven decision-making. Historical information, current performance, and AI-powered insights can support better business planning and strategy.
Our AI Dashboard modules include:
The Sales Dashboard provides a centralized view of sales performance. Businesses can monitor sales revenue, orders, customer performance, sales trends, and other important sales KPIs. This helps sales teams and management understand performance and identify opportunities for improvement.
The Finance Dashboard provides better visibility into financial performance. Businesses can monitor revenue, expenses, receivables, payables, profitability, and other financial indicators from a single dashboard. This helps management make better financial decisions and maintain greater control over business finances.
The Inventory Dashboard helps businesses monitor their stock levels and inventory performance. Users can track available stock, inventory movement, low-stock items, stock valuation, and other inventory-related information to improve inventory planning and control.
The HR Dashboard provides insights into workforce-related information. Businesses can monitor employee performance, attendance, workforce statistics, and other HR indicators. This helps HR teams and management better understand workforce trends and improve resource planning.
The Purchase Dashboard provides visibility into procurement activities. Users can monitor purchase orders, suppliers, purchasing trends, purchase costs, and other procurement KPIs. This helps businesses improve purchasing decisions and supplier management.
The Manufacturing Dashboard helps organizations monitor production activities and manufacturing performance. Businesses can track production orders, material consumption, production progress, efficiency, and other manufacturing indicators to improve operational visibility.
An AI Dashboard is a business analytics solution that combines dashboards, data visualization, automated reporting, and artificial intelligence to help businesses monitor performance and gain meaningful insights from their data.
An AI Dashboard helps businesses improve visibility, reduce manual reporting, analyze performance, monitor KPIs, identify trends, and make data-driven decisions.
Yes, the AI Dashboard can be designed to work with ERPNext and use relevant business data from different ERPNext modules to provide centralized reporting and analytics.
An AI Dashboard can display information related to sales, finance, inventory, purchasing, HR, manufacturing, customers, suppliers, and other business processes depending on the organization's requirements.
Yes. Dashboards can be customized according to the organization's reporting requirements, KPIs, departments, business processes, and preferred data visualizations.
AI-powered dashboards can support natural-language interactions, allowing users to ask questions about available business information and receive relevant insights without manually searching through multiple reports.
AI-powered analytics can analyze available historical and operational data to identify patterns and trends that can support forecasting and future business planning.
SMB Solutions can provide customized business solutions that combine ERP, analytics, dashboards, and automation to help organizations gain better visibility into their operations and make data-driven decisions.
Enhancing Operations for a Romanian Bakery Chain Industry: Food – Confectionery Business Overview: Operating 13 outlets in Kuwait Challenges: POS...

Al Amre’s Transformation with ERPNext Introduction: Al Amre, a prominent company specialising in Acrylic design and custom furniture manufacturing, operates...

Kharafi Global Bredz Factory: Transforming Confectionery Operations with ERPNext Industry: Food – Confectionery About the Company: Proudly one of the...
Cloudtime Time Attendance Solution. Industry: Manufacturing – Wires & Cable Transforming GulfCable’s Workforce Management with Cloudtime time attendance solution Meet...